


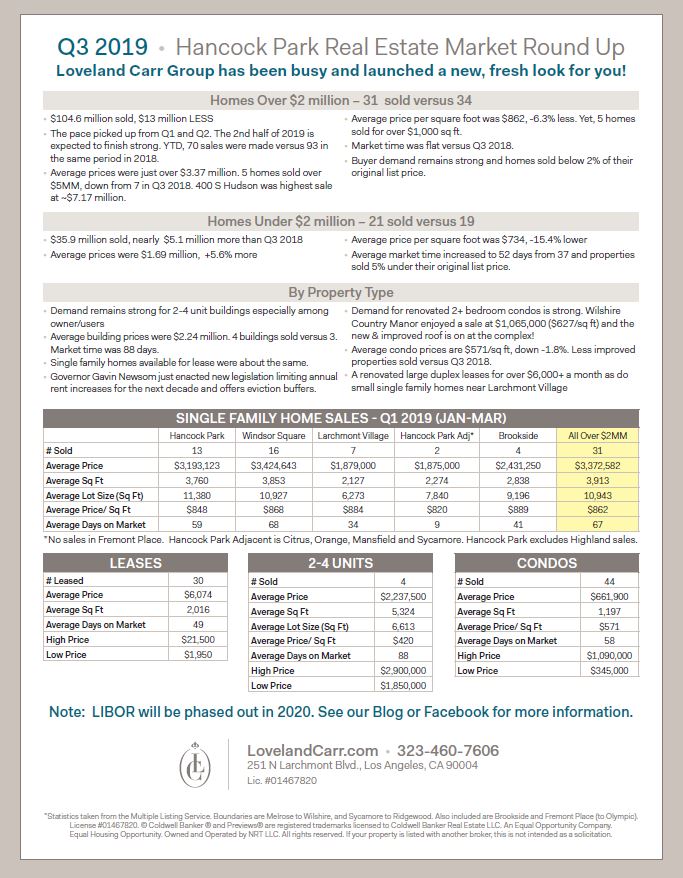
Homes OVER $2 million – 31 sold versus 34
- -$104.6 million sold, $13 million LESS than Q3 2018.
- -YTD, 70 sales were made versus 93 in the same period in 2018. The pace has picked up from Q1 and Q2. The 2nd half of 2019 is expected to finish stronger than the 1st half.
- -Average prices were just over $3.37 million. 5 homes sold over $5MM, down from 7 in Q3 2018. 400 S Hudson was highest sale at ~$7.17 million.
- -Average price per square foot was $862, -6.3% less. Yet, 5 homes sold for over $1,000 sq ft.
- -Market time was flat versus Q3 2018.
- -Buyer demand remains strong and homes sold 2% below their original list price.
Homes UNDER $2 million – 21 sold versus 19
- -$35.9 million sold, nearly $5.1 million more than Q3 2018
- -Average prices were $1.69 million, +5.6% more
- -Average price per square foot was $734, -15.4% lower
- -Average market time increased to 52 days from 37 and properties sold 5% under their original list price.
By Property Type
- -Demand remains strong for 2-4 unit buildings especially among owner/users
- -Average building prices were $2.24 million. 4 buildings sold versus 3. Market time was 88 days.
- -Governor Gavin Newsom just enacted new legislation limiting annual rent increases for the next decade and offers eviction buffers.
- -Demand for renovated 2+ bedroom condos is strong. Wilshire Country Manor enjoyed at $1,065,000 sale at $627/sq ft and the new & improved roof is on at the complex!
- -Average condo prices are $571/sq ft, down -1.8%. Less improved properties sold versus Q3 2018.
- -Single family homes were available for lease were about the same.
- -A renovated large duplex leases for over $6,000+ a month as do small single family homes near Larchmont Village