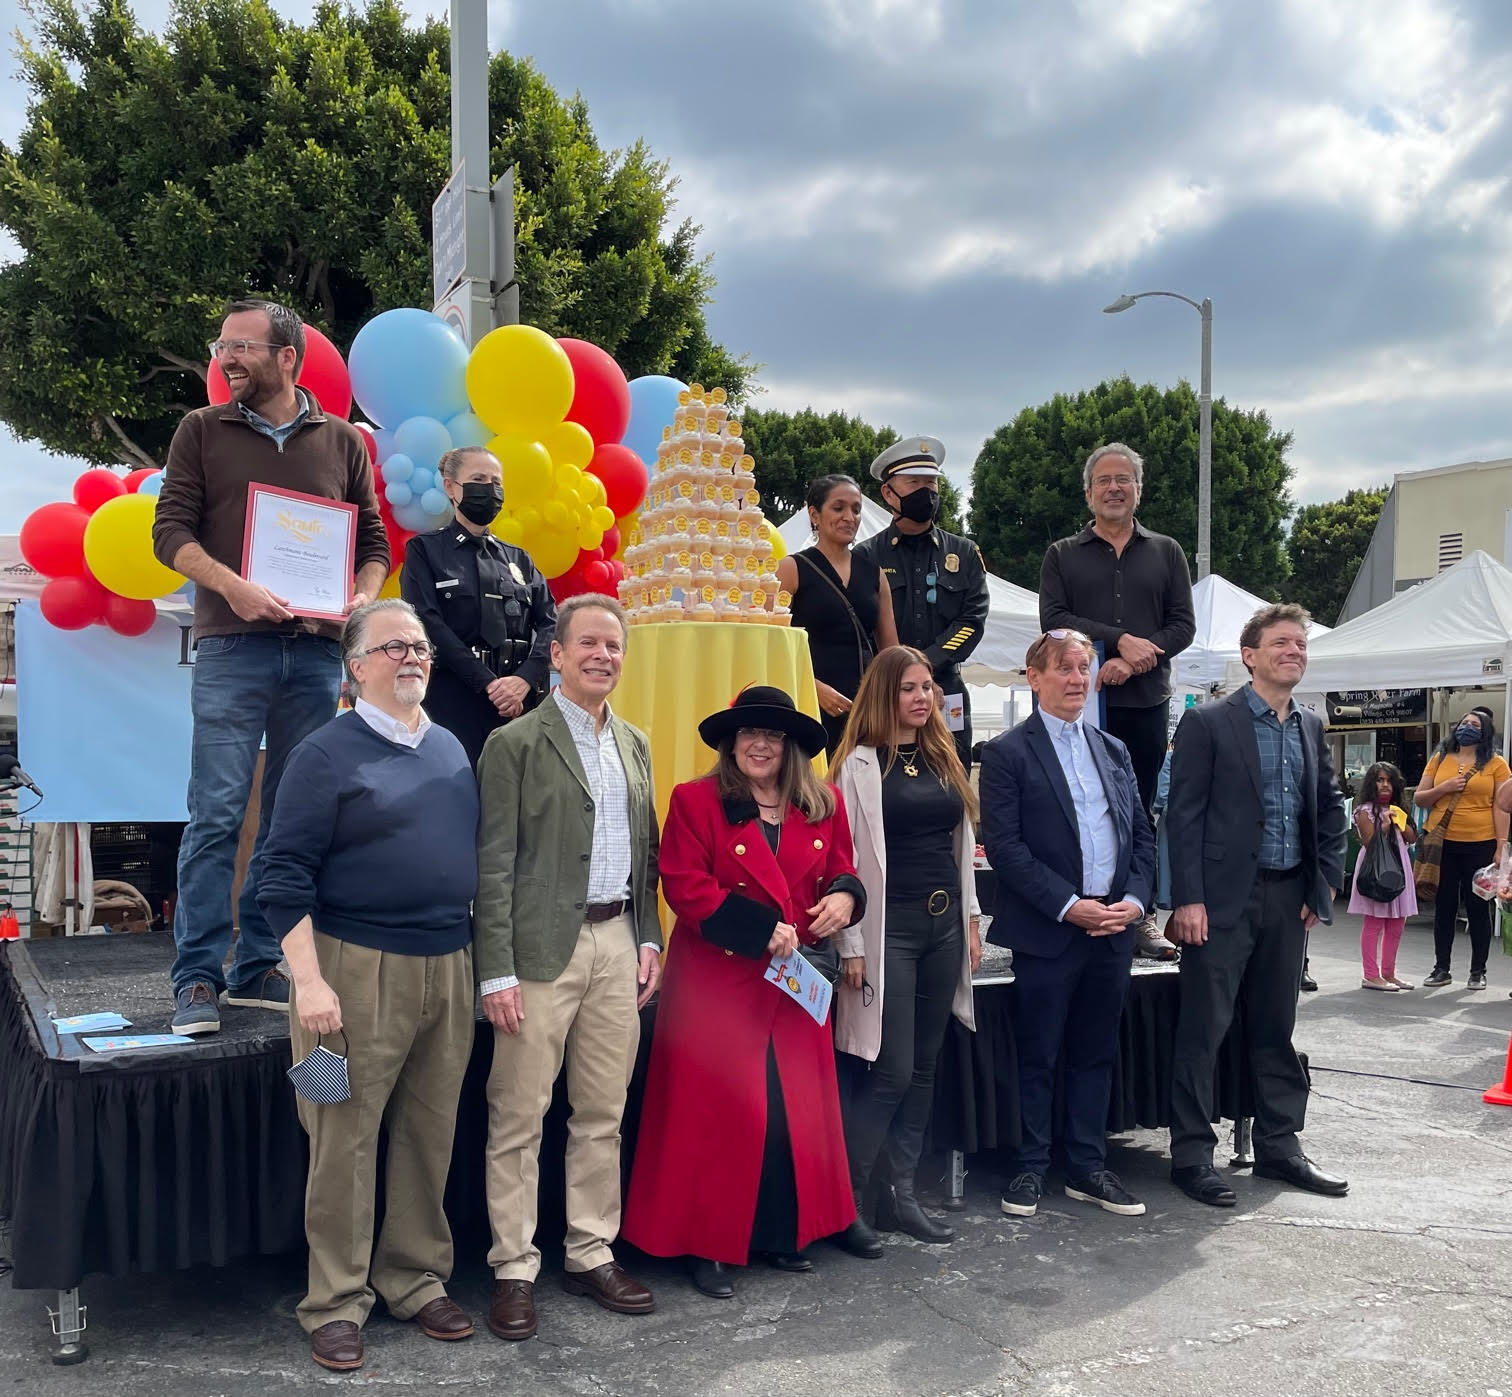
Larchmont Village turned 100 and the centennial was celebrated with CAKE! The October edition of the Chronicle delivered a great spread spanning the decades. Neighbors pulled together to refresh and re-launch the beloved Center for Yoga. Great White made a splash with its crisp modern vibe, friendly staff and broad menu selection at breakfast, lunch and dinner. Go Get ‘em Tiger offered free Ted Lasso biscuits and generated crowds. What a wonderful way to see many friends again. The Boulevard has a renewed spirit and energy again. Here’s to keeping the momentum in our very own “Mayberry”!
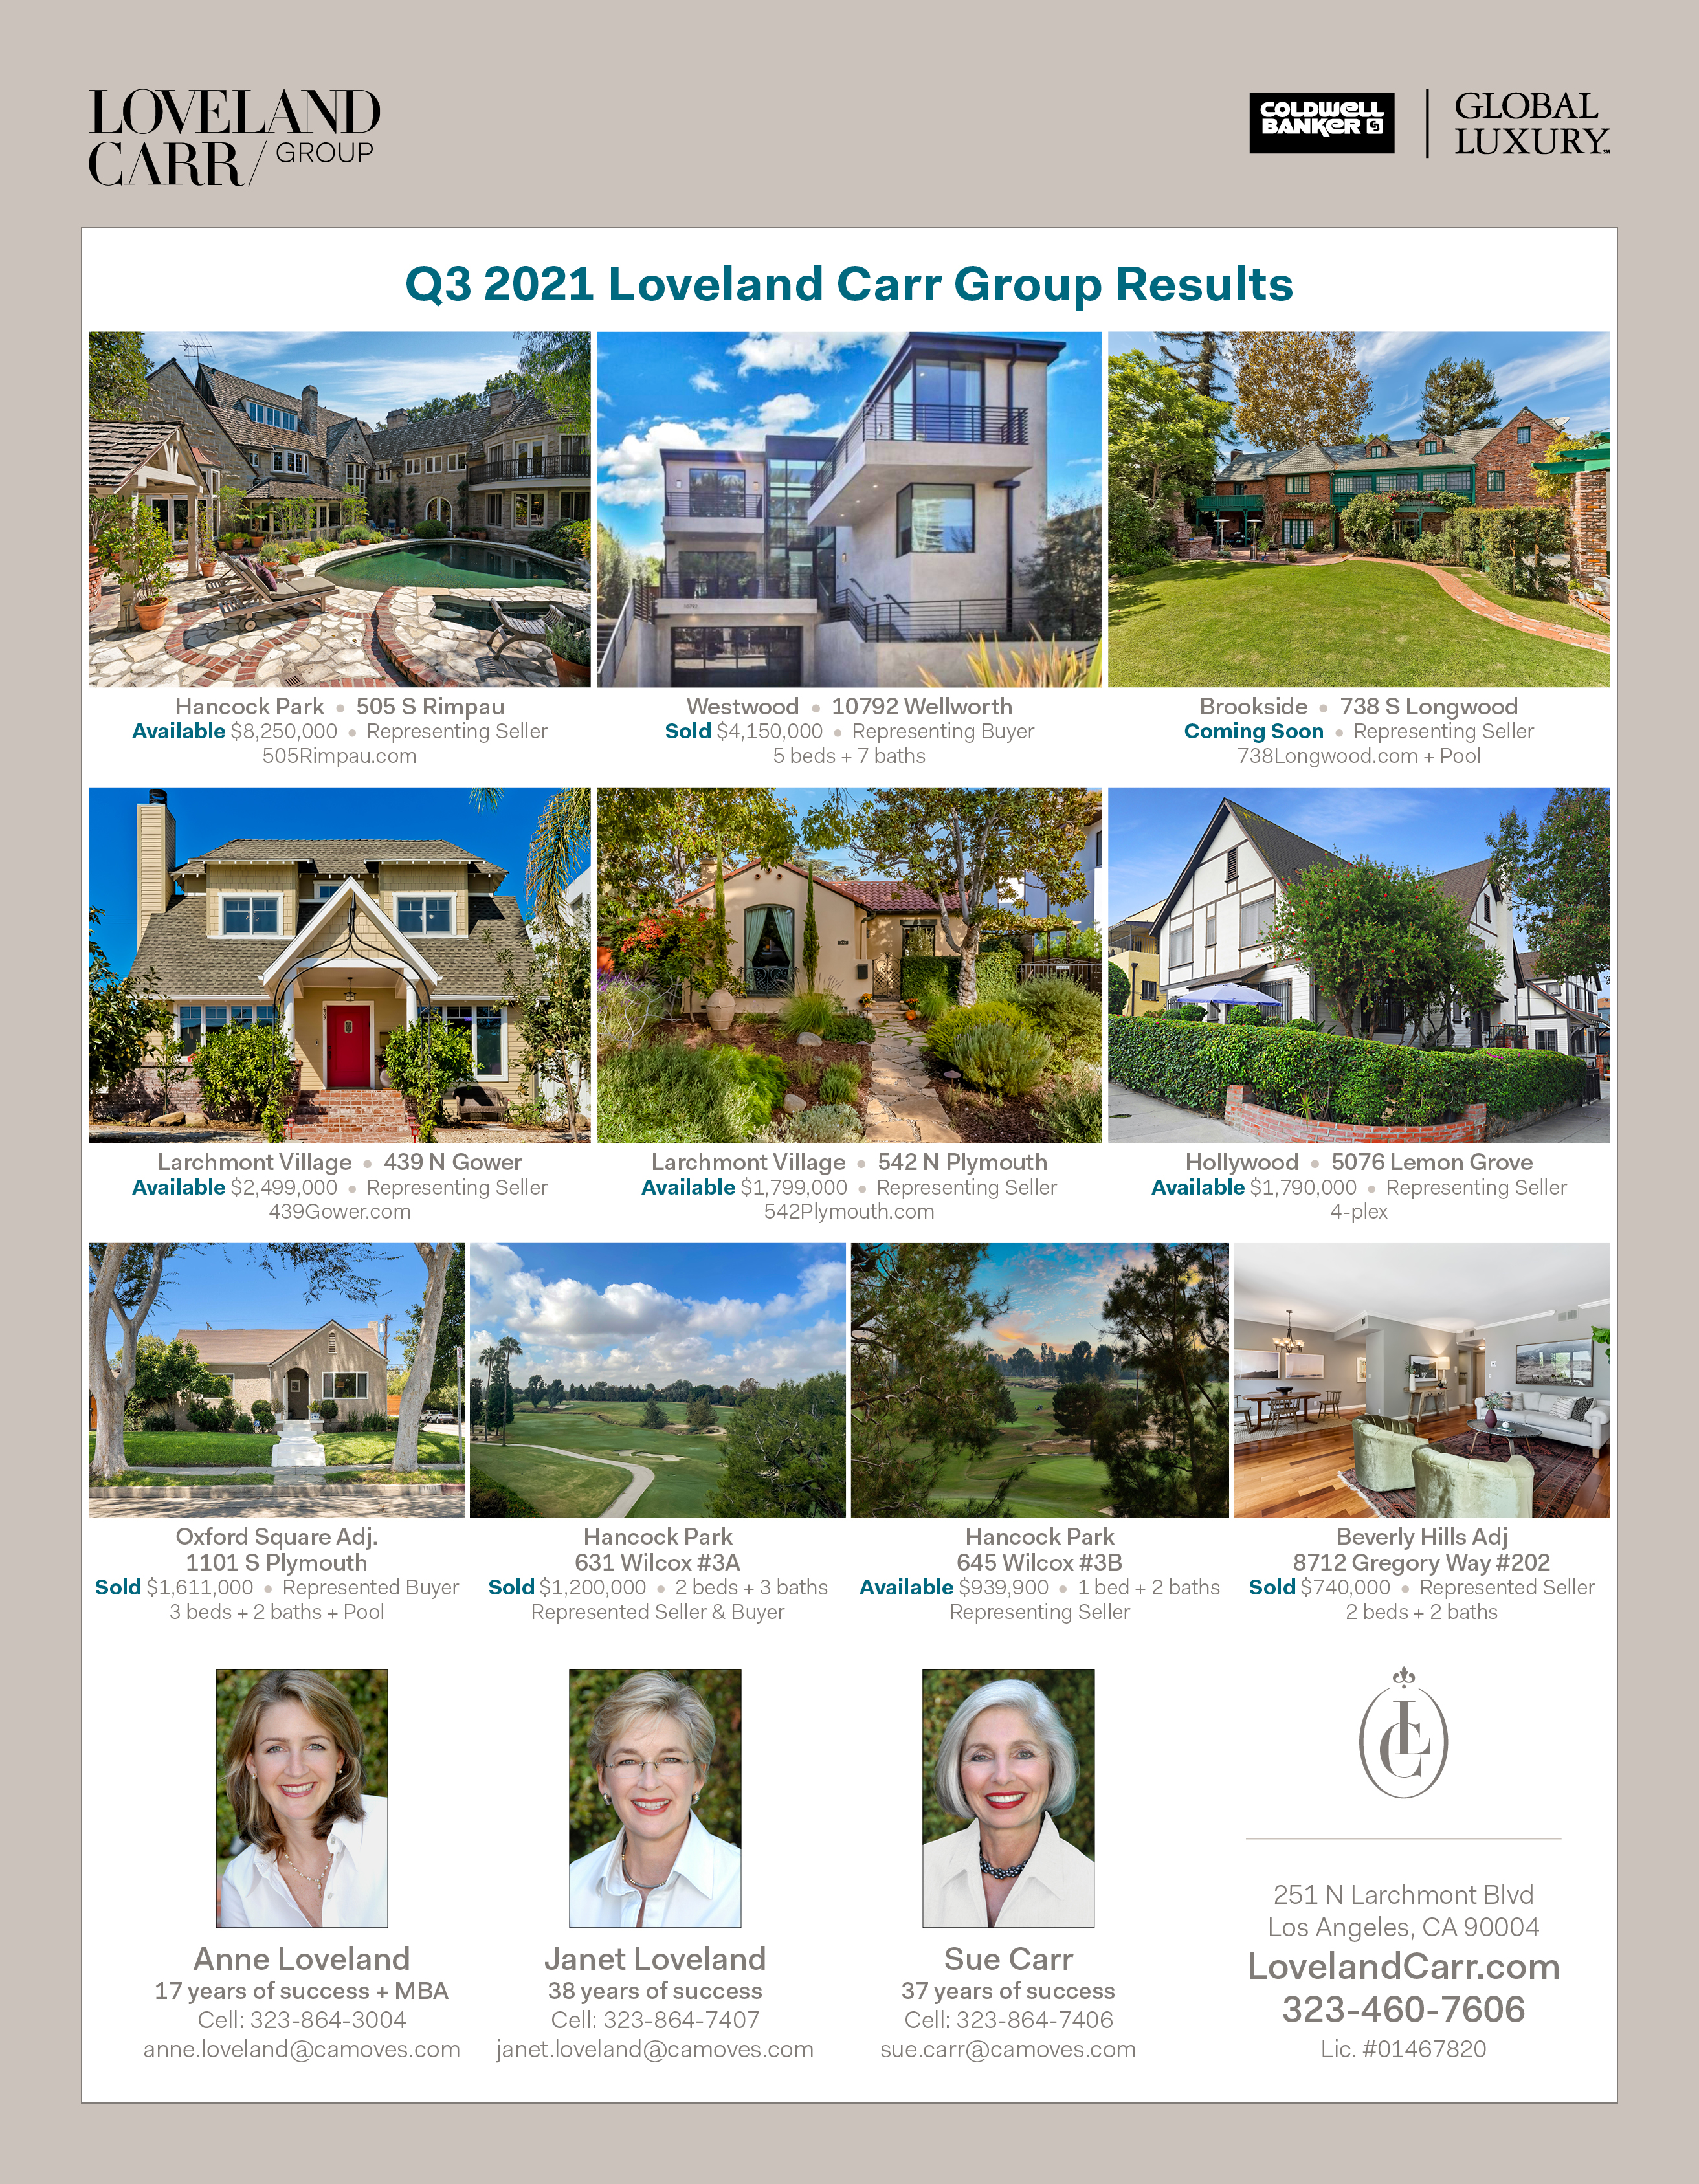
Similarly, the high end of the real estate market was invigorated. 8 properties sold over $6MM in Q3 versus only 4 last year. 3 sales were over $9MM! Currently there 3 estates on the market over $20MM! Demand remains high for properties that make people feel good – be it with land, style, condition and/or swimming pools. Multiple offers are common for the most coveted. Homes that are perceived to be “dated” or needing work are most sensitive to pricing and market time. Under $2MM, 15 properties sold over $1,100/square foot versus only 9 in Q3 ’20!
A noteworthy “paired sale” in Q3: William Heffner designed 120 N McCadden sold for $7.3MM, a 5% increase in less than 2 years ago since its last sale. Home is our sanctuary and Larchmont Village the heart of our community.
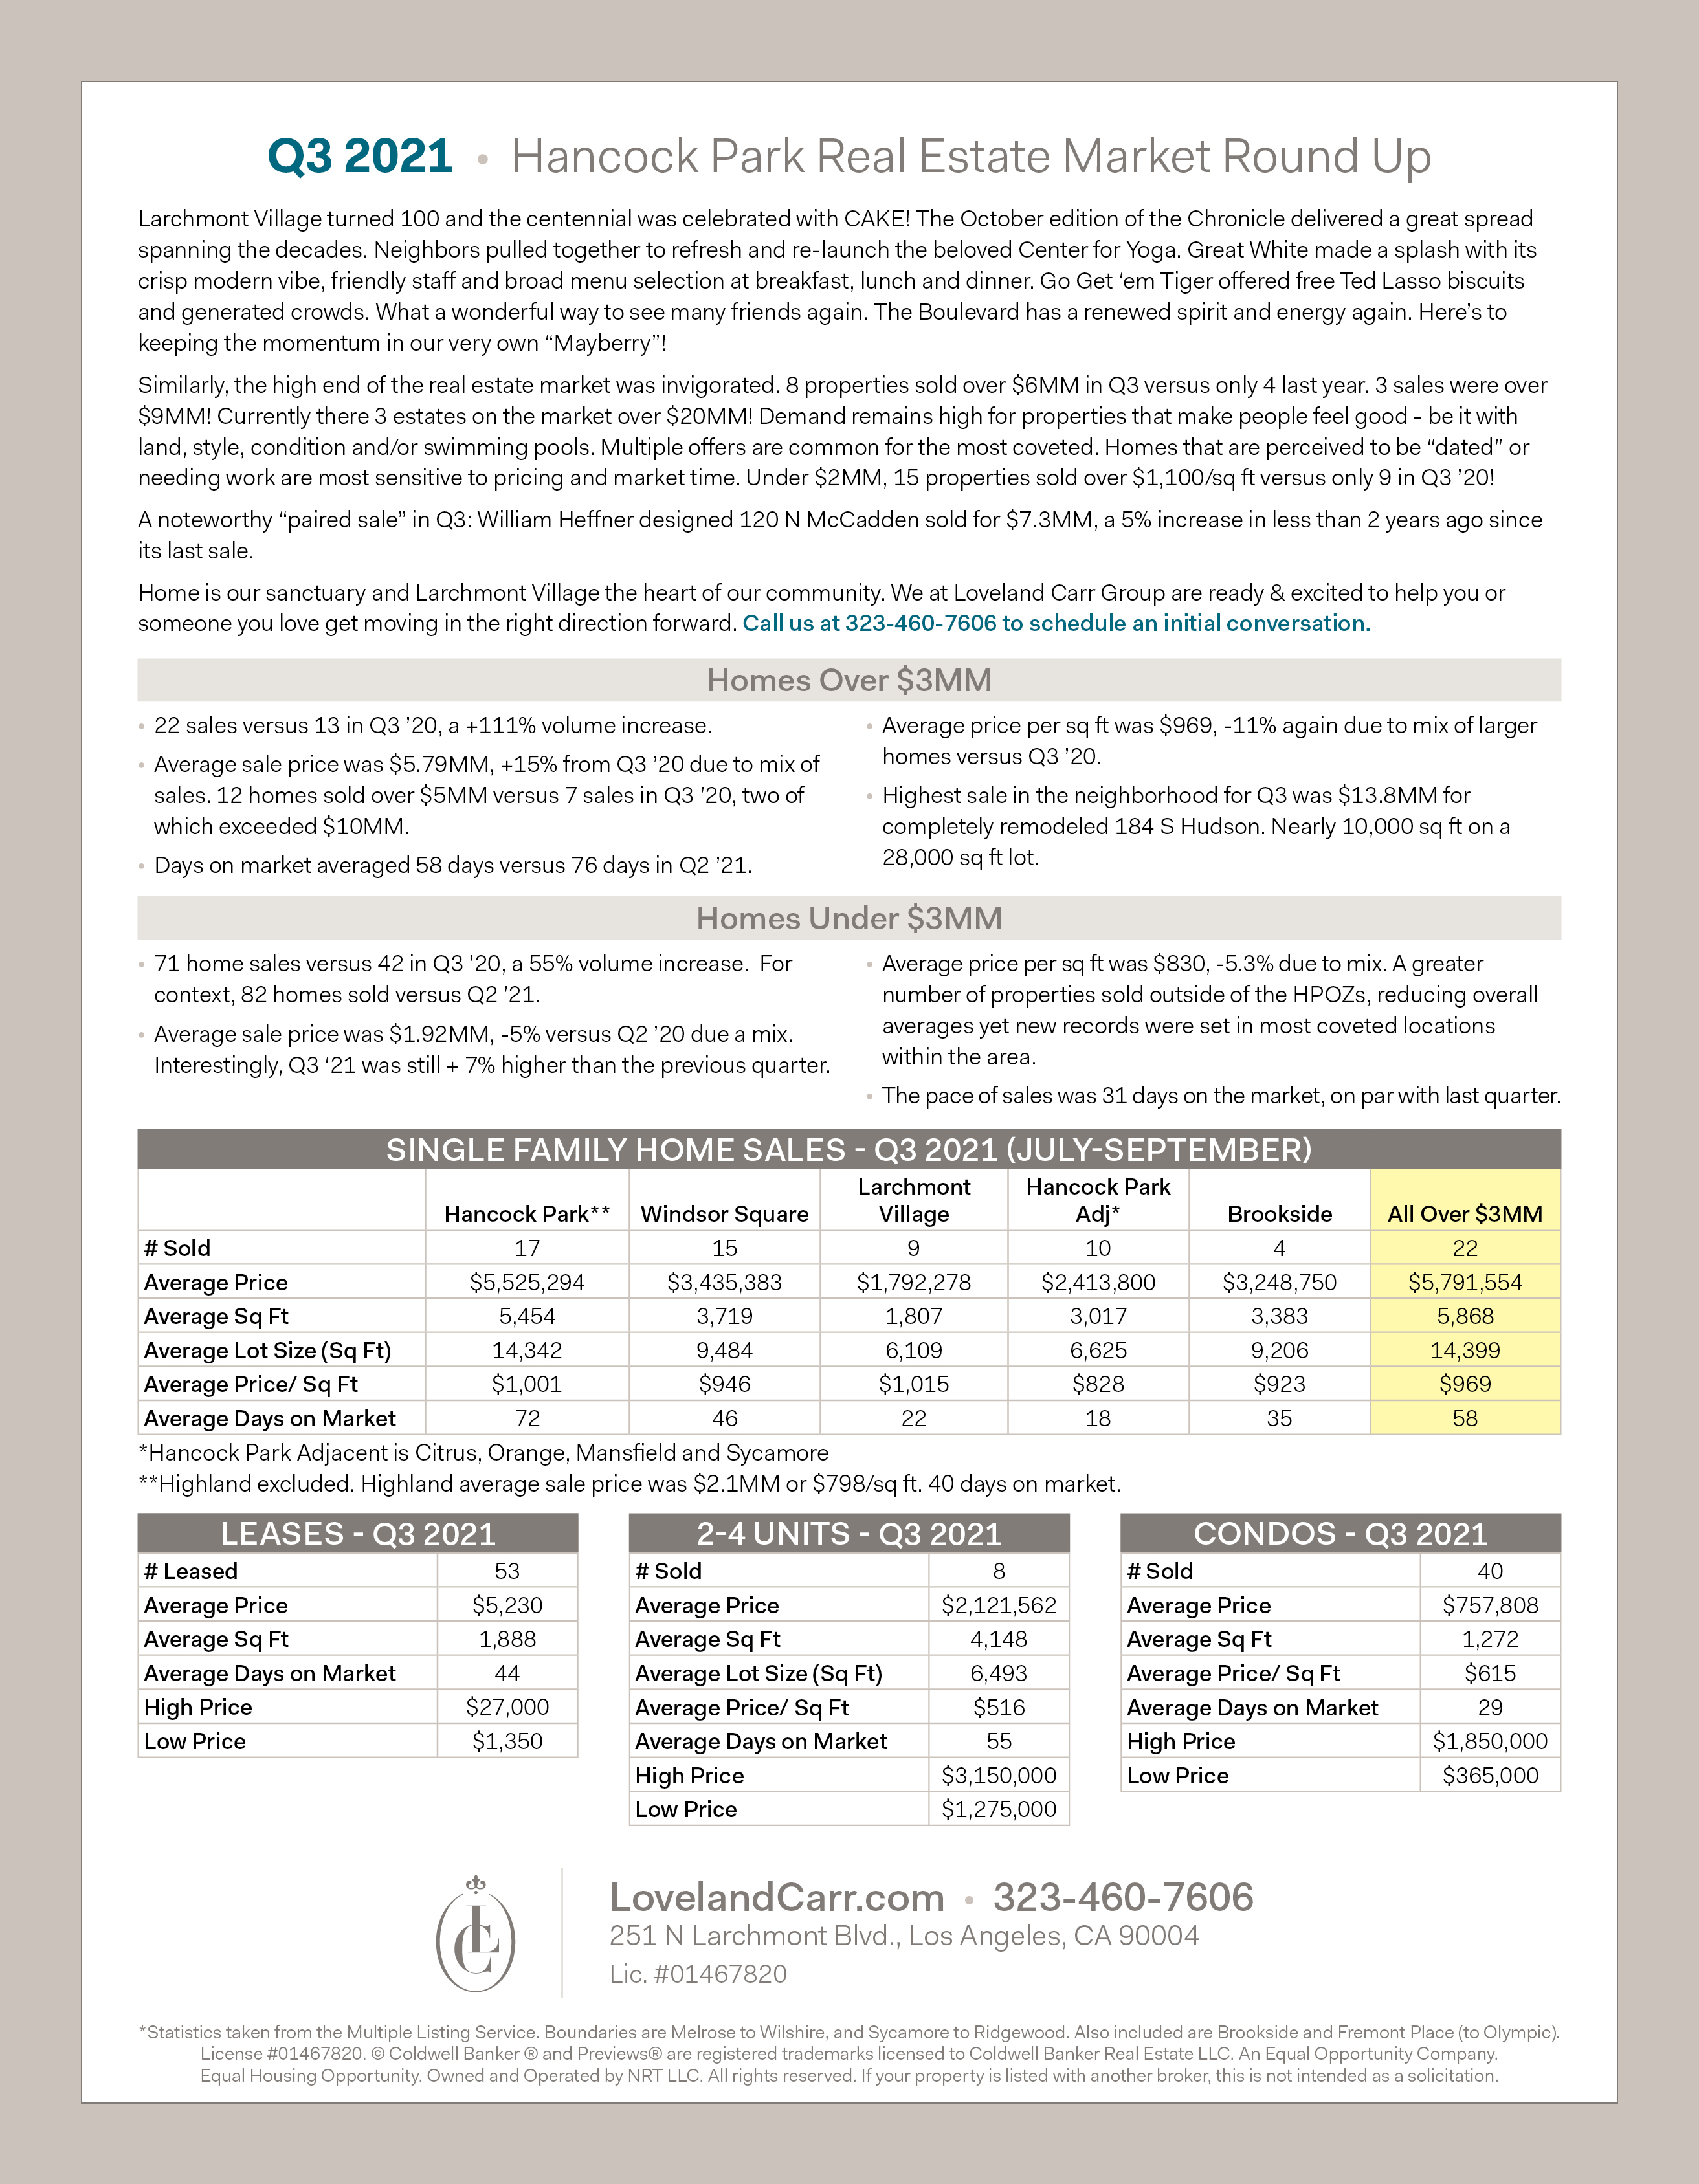
Homes Over $3MM:
• 22 sales versus 13 in Q3 ’20, a +69% volume increase.
• Average sale price was $5.79MM, +15% from Q3 ’20 due to mix of sales. 12 homes sold over $5MM versus 7 sales in Q3 ’20, two of which exceeded $10MM.
• Days on market averaged 58 days versus 76 days in Q2 ’21. • Average price per sq ft was $969, -11% again due to mix of larger homes versus Q3 ’20.
• Highest sale in the neighborhood for Q3 was $13.8MM for completely remodeled 184 S Hudson. Nearly 10,000 sq ft on a 28,000 sq ft lot.
Homes Under $3MM:
• 71 home sales versus 42 in Q3 ’20, a 69% volume increase. For context, 82 homes sold versus Q2 ’21.
• Average sale price was $1.92MM, -5% versus Q2 ’20 due a mix. Interestingly, Q3 ‘21 was still + 7% higher than the previous quarter.
• Average price per sq ft was $830, -5.3% due to mix. A greater number of properties sold outside of the HPOZs, reducing overall averages yet new records were set in most coveted locations within the area.
• The pace of sales was 31 days on the market, on par with last quarter
We at Loveland Carr Group are ready & excited to help you or someone you love get moving in the right direction forward. Call us at 323-460-7606 to schedule an initial conversation.