Q4 2021 Hancock Park Real Estate Market Round Up
2021 was a remarkable year for real estate citywide AND in Hancock Park. Record prices were set in our neighborhood and the $20MM threshold was just surpassed with the sale of 355 S Muirfield Rd. The stock market remains strong and there continues to be more demand for most homes than there is supply.
The Fed announced it will raise interest rates three times to 4% or higher by the end of 2022 to ease inflation. For those considering selling in the next few years it is wise to seize this moment and start the conversation with a professional now. As rates increase, the value of your home will affected at some point. We saw this as recently as 2018.
Loveland Carr Group has had the privilege of serving so many during challenging times. We embrace change swiftly and would be delighted to help you or a loved one navigate through your real estate transition. Contact us to begin the conversation!
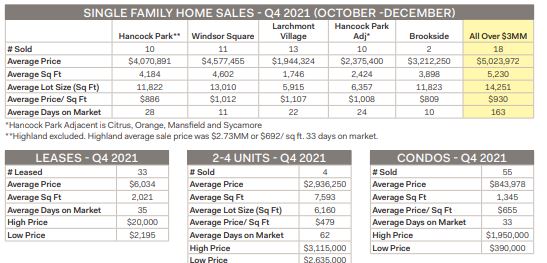
Homes Over $3 Million
- 18 sales versus 22 sales in Q4 ’20. There were also 22 sales in Q3 ’21
- Average sale price was $5M, -5.4% from Q4 ’20 due to mix. Last year there were 6 sales over $6MM versus 4 sales in Q4 ’21. The estates in Q4 ’20 had larger lots than Q4 ’21 sales and were therefore more expensive at that time.
- Average price per square foot was $991 versus $995 in Q4 ’20.
- Market time was heavily skewed in Q4 ’21 by a few homes that were very overpriced to start and took over a year to sell. Average days on market were 63 days and the median time was 22 days
- Highest sale in the neighborhood for Q4 ’21 was $ 10,359,500 for 324 S June after 50 days on the market. Close behind was 601 S Windsor which started at $11,995,000 and sold for $10,270,000 in December after 449 days on the market.
- Windsor Square average prices were skewed in Q4 by 601 S Windsor.
Homes Under $3 Million
- 42 sales versus 32 in Q4 ’21, a +31% volume increase. The pace slowed from Q3 ’21 in which 72 homes sold.
- Average sale price was $ 2.1MM virtually flat from Q4 ’20. Price were up nearly 10% from last quarter.
- Average price per square foot was $861, + 12.5% due to a higher mix of homes with smaller lot sizes.
- The pace of sales was swifter at 24 days on market versus 39 days in Q4 ‘20.